 Diagnostics View
 Diagnostics View
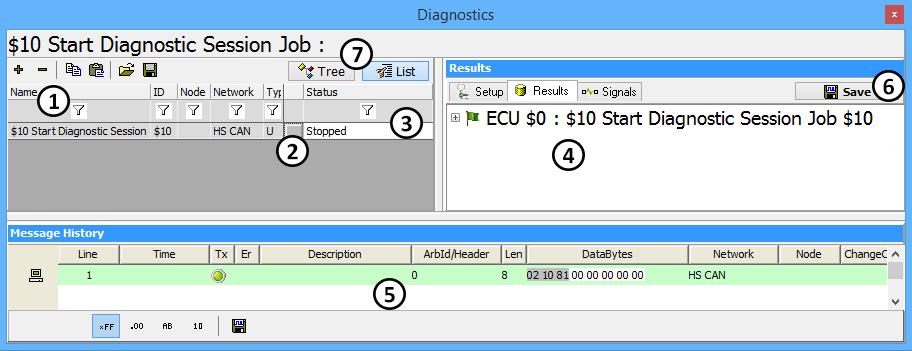
Diagnostic jobs are launched using the Diagnostics screen (Figure 1) in Vehicle Spy. This screen
is found under Spy Networks> Diagnostics.
Use the + button in the upper left to add jobs from the specified
diagnostic service. You can remove a job by selecting the - button from the same area.
Jobs will be listed under the Name field on the left
(Figure 1: ). To launch a job, click the gray button just
right of its name (Figure 1:
 ). The job Status
column (Figure 1:
 ) will tell you if the job is running
or complete.
The response data appears in three locations in different formats. The simplest two are found in the
Results area (Figure 1: ).
).
The default view is the Results tab which gives the information in a simple text
based format. Each line can be expanded to show more details by clicking the + in
front of the text.
Clicking on the Signals tab will display the response data in a table format. The
table includes information like number of negative responses, success, time the service took to run,
and the decoded signals that were returned.
The other place to see the response data is in the Message History area
(Figure 1: ). This shows a small message history filtered for
diagnostic messages. The acquired data can be saved using the Save button
(Figure 1:
 ).
).
Tree and List (Figure 1: ),
give two different ways to sort diagnostic jobs. List shows all the diagnostic jobs
in a list, while Tree groups ECUs and jobs.

*Note: Signals acquired from diagnostic jobs can be used throughout Vehicle Spy just like any other signal. In the Expression Builder, diagnostic signals are saved under Jobs.