 Data Analysis: Tool Dialog
 Data Analysis: Tool Dialog
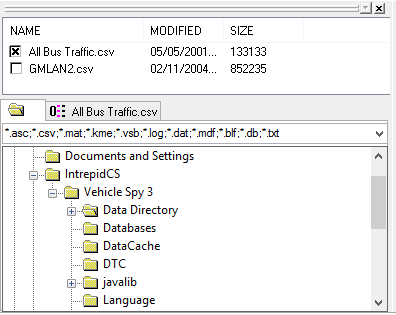
The Tool Dialog (Figure 1) is mainly used for selecting data files and the channels within those
files. The window is docked in the upper left portion of the
Data Analysis view, but can be docked on either side of the plotter.
The Show menu can toggle the Tool Dialog display on and off.
The upper half is the data file selection list. The lower half has a directory tab (active in Figure 1)
and selected data file tabs.

Directories contain data files and data files contain channels (or signals). The upper half
of the Tool Dialog displays files in the currently selected directory. Simply click the
checkbox next to a data file name to select it.
If the selected data file contains valid signal information then various things will happen.
First, the Messages view will display the data file contents and be synchronized in time with
the Data Analysis plot x-axis. Second, a numbered tab for the data file is created in the
Tool Dialog. Third, an x-axis is added to the plotter area.
As an example, Figure 1 shows the directory "User name 2" is selected. The checkboxes for the
first two data files in that directory are also selected. Each data file gets a numbered tab
(0 and 1) because they both have valid signal information. Although not shown here, the
plotter area will have two x-axes.
The text field just above the directory tree filters for specific file extensions. Leave the
filter field blank to see all files in a directory. Click on other folders in the tree to find
data files in other directories.
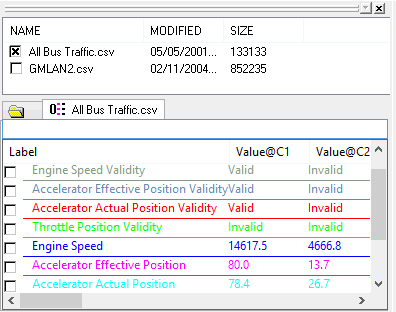
To select a channel, first display a channel list by clicking on a numbered data file tab. Next, click the checkbox next to the desired channel as shown in Figure 2. Whenever a channel is selected these areas in Data Analysis are updated:

Channel measurement columns can be enabled with the Plotter Options
window, Channel List tab. Open the window by selecting "Options" from the right click menu or the
"Configurations" main menu. Descriptions of each channel measurement are in the
Channel Value Pane help topic because the same measurements can
be displayed there too.
Each column header in the channel list can be clicked to sort the column A-Z or Z-A. Also, the measurement
columns can be rearranged by dragging and dropping their column headers to desired locations.
The entry field just above the channel column headers is used to filter the channel list. In Figure 2 for
example, the text "speed" is being used to only show channel labels containing the text "speed". Leave the
filter field blank to see all channels in the data file.
There is an extensive right mouse menu while hovering over the channel selection list. The right mouse
menu selections are straightforward, but more help is available for the
Create calculated channel selection.