 Data Analysis
 Data Analysis
Data Analysis is a powerful tool for graphically displaying and analyzing the data in files collected
from vehicle networks. It can be accessed through the Vehicle Spy
Measurement menu.
Data can come from a variety of sources, including buffer files,
log files, and files obtained from
Capture Type Function Blocks. These files are all typically
found in the current user's Data Directory.
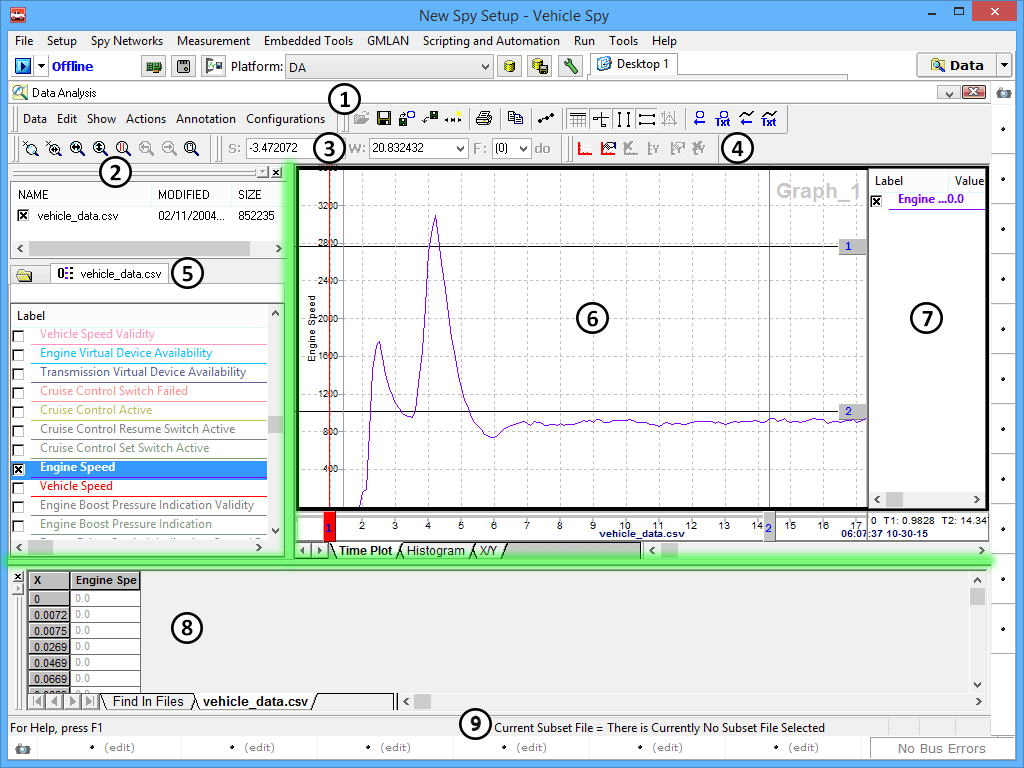
An example of the Data Analysis feature in Vehicle Spy can be found in Figure 1, which shows a single plotted signal. The view can be conceptually divided into four areas. On the top is a set of toolbars, and below that are three partitions:
You can adjust the relative sizes of these partitions by dragging the vertical and horizontal divider bars that separate them, which are shaded in green in Figure 1.
There are four toolbars, which appear at the top of the Data Analysis display in Figure 1. You may see
a different default layout when you first open the feature, and not all toolbars may appear initially;
they can be enabled or disabled via the Show menu.
Notice that there are two vertical bars ( )
at the left edge of each toolbar. You can click on these bars, then drag and drop the toolbar to a
different location.

Table 1 contains information on the individual areas in the Data Analysis view. Each entry contains a description of the region, a reference to its location in Figure 1, and a clickable link to a page that describes it in detail.
| Area | Description |
|---|---|
 Main Menus and Toolbar Main Menus and Toolbar |
The menus contain most of the options for controlling the Data Analysis feature, such as opening and closing files, showing or hiding areas of the screen, printing, displaying cursor information, and setting plotter labels, configurations, and plotter options. The Main Toolbar buttons are a subset of the controls from the menus. |
 Zoom Toolbar Zoom Toolbar |
Contains tools for controlling plotter zoom features. |
 X-Axis Input Toolbar and Dialog X-Axis Input Toolbar and Dialog |
Provides quick X-axis control of the (S)tarting point and (W)idth for the data (F)ile being plotted. |
 Plotter Setup Toolbar Plotter Setup Toolbar |
Allows the plotter to be divided into multiple plotter areas, and provides controls for the plot's Y-axis. |
 Tool Dialog Tool Dialog |
Allows you to select a data file and channels within that file using checkboxes.The channel selection list includes configurable columns to display various channel statistics. This area also contains a file directory tree. |
 Plotter Area Plotter Area |
Displays time plot, histogram, or X/Y plots for the selected channels. |
 Channel Value Pane Channel Value Pane |
Displays all available channel statistics for the selected channels. |
 Output Bar Output Bar |
Contains a table showing the entire list of data points for the selected channels. |
 Status Bar Status Bar |
Shows Data Analysis status messages, the current subset file, if any, and the state of the Caps Lock, Num Lock and Scroll Lock keys. |