 Collections and Methods: Histogram Method
Collections and Methods: Histogram Method
Collections and Methods: Histogram Method
The Histogram Method of data collection in VehicleScape DAQ Standalone Logging records the frequency of data points across a value range over a period of time. The settings in this area are broken into two main subsections, Histogram Axis Configuration and Sample Options, which are described below.
The Status Reporting, Power Management and Generation Options sections in the bottom half of the Standalone Logging Tab apply to all method types, including the Histogram, Message Capture, Bus Query and Ethernet DAQ methods.
This is the main part of the Histogram Method view, where you define the characteristics of the histogram you want to generate.
Begin by defining the dimensions of the histogram; that is, choosing the number of axes in the configuration. Choices are as follows (Figure 1):

You must choose an expression and make appropriate settings for each of the axes selected in the preceding step. This is accomplished using the main expression selection and settings area shown in Figure 2.
Each axis has its own settings, and you can swap among them by clicking on the axis tabs found on the left side of the Histogram Axis Configuration area.
Changing the dimension of the histogram will add or remove tabs from the list;  )
)
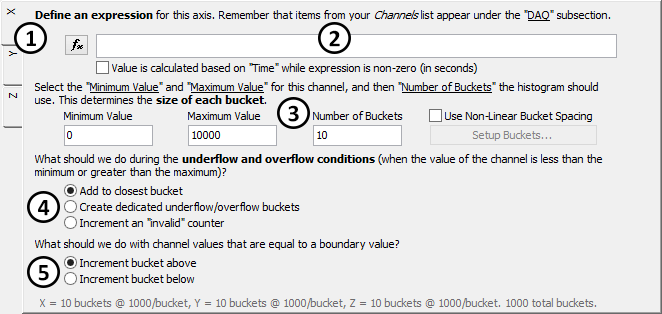
Press the  button to define an expression for the current axis using the Expression Editor
(Figure 2:
button to define an expression for the current axis using the Expression Editor
(Figure 2: ).
).
Just below the expression box is a checkbox option: Value is calculated based on "Time" while expression is non-zero (in seconds). When selected, this means the collection will count the length of time (in seconds) that the axis expression is non-zero. Use this to count how often an event of varying duration has occurred.
The Minimum Value is the lowest value that will be logged for the current channel for this axis, and the Maximum Value is the highest figure. The Number of Buckets determines how many categories into which the full range of values is split to create the histogram.
For example, the default settings shown in (Figure 2: ) define a histogram where the lowest possible value is 0, the highest is 10,000 and the number
of buckets is 10. This means that each bucket will have a size of 1,000. Remember that these values, which are summarized at the bottom of Figure 2, are set on a per-axis basis.
) define a histogram where the lowest possible value is 0, the highest is 10,000 and the number
of buckets is 10. This means that each bucket will have a size of 1,000. Remember that these values, which are summarized at the bottom of Figure 2, are set on a per-axis basis.
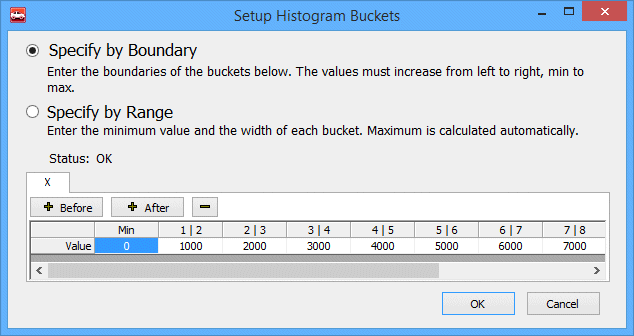
By default, all buckets are the same size, split evenly across the defined value range between Minimum Value and Maximum Value. If you check Use Non-Linear Bucket Spacing, you can then click the Setup Buckets... button to bring up the Setup Histogram Buckets dialog box (Figure 3). Here you can set customized buckets of variable size. Choose from defining the setup based on the boundary values between adjacent buckets, or specifying each bucket's minimum value and width.
This selection determines how to handle values that fall outside the defined range: underflow (values below the defined Minimum Value parameter) and
overflow (values above Maximum Value). The choices (Figure 2: ) are as follows:
This option specifies how to handle values that exactly equal a boundary between buckets  )
)
The settings in this part of the Histogram Method setup control when and how samples for the histogram are taken. There are two basic choices:
The available options change based on which of these selections is made.
The default setting is to sample periodically using the specified time interval (default is every 1 second). Figure 3 shows the settings available in this mode.
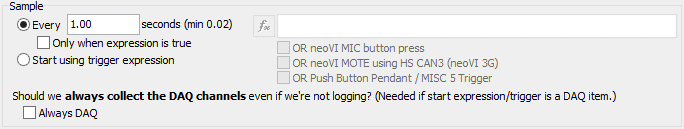
Checking the Only when expression is true box causes data to be logged periodically only when the specified expression is true. Press the
button to select the expression; you can also check boxes to enable any of the following events as triggers for sampling:
When this option is selected, the settings in this area appear as in Figure 4.
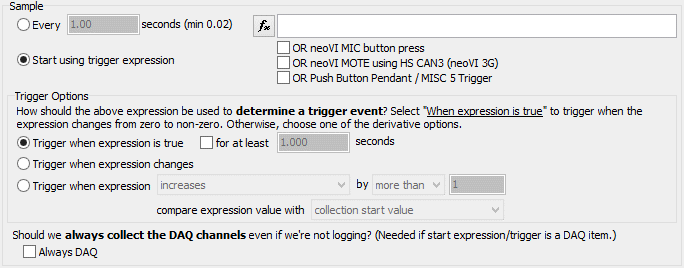
Press the button to select the expression, and optionally check boxes to enable any of the following events as triggers:
There are three options for determining when a trigger event has occurred:
When enabled, always request DAQ items even if they are not being logged. Requested DAQ items are diagnostic signals that get polled from ECUs like DTCs, PIDs, ISO 14229 IDs, and MEP A2L file data items. This must be enabled if the trigger is a DAQ item.